Part of text and figures are adapted from Faccioli E. e R. Paolucci: “Elementi di Sismologia applicata all’Ingegneria”, Pitagora, 2005.
A
- Accelerometer
-
Instrument to measure seismic acceleration. It can be of two types:
analog instrument: ground acceleration is reproduced by a mechanical instrument on a physical support, typically paper or photographic film, and it is digitized at a later stage.
digital instrument: it is typically based on either electro-magnetic or force-balance transducers. The electric signal is then properly conditioned, sampled and digitized. The digital instruments are operating from about the mid-80s.
The most representative parameters defining the characteristics of the recording instrument response are as follows:
- sensor undamped natural vibration frequency (frequency);
- sensor damping coefficient with respect to critical (damping);
- frequency band for which the sensor gives a flat response (frequency band);
- generator constant of the sensor (gain);
- smallest signal that can be resolved by the sensor (sensitivity);
- maximum signal that can be resolved by the sensor (full scale);
- number of bits of the recorder (number of bits).
- Active Fault
-
A fault segment that has moved within a time lapse that can be associated with recent to present-day activity normally in the last 10.000-100.000 years. Such manifestations may include for instance mild warping of the ground-surface associated with the effects of an active fault or geodetic data indicating crustal movement across a particular region otherwise known for seismic activity.
- Adimensional Spectra
-
Response Spectra whose ordinates are divided by their PGA (see PGA).
- ag [g]
-
Peak ground acceleration (see PGA) value to which the target spectrum (see Target Spectrum) is anchored
- Arias Intensity
-
A ground-motion parameter derived from an accelerogram and proportional to the integral of the acceleration squared over the entire signal duration.[1]
Introducing the function of motion intensity:
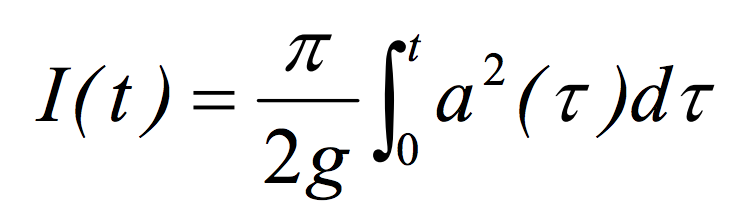
where a(t) is the acceleration at time t and g the gravity acceleration, the Arias Intensity is the maximum value of this function, i.e.:
IA = I(Td)
where Td is the accelerogram total duration
Arias Intensity is dimensionally a velocity [cm/s]
A sample of calculation of the Arias Intensity is shown in the figure (see Duration)
- Aseismic
-
An event or process detected by geological/geophysical tools and analyses that is apparently not accompanied by earthquake activity.
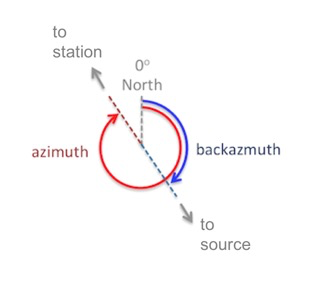
- Azimuth
-
In general, a direction measured clock-wise in degrees against the North.
In seismology, used to measure the direction from a seismic source to a seismic station recording an event.
B
- Backazimuth
-
The direction from the seismic station towards a seismic source, usually measured in degrees clock-wise from North.
It is 180° off from the azimuth.
- Bad Quality Record
-
Poor quality waveforms e.g. affected by unsatisfactory signa-to-noise level, spurious spikes or early termination during coda.
- Bandwidth
- Baseline Correction
-
Baseline correction is a procedure to correct certain types of long period disturbances on accelerometric signals, both analog and digital.[1]
The simplest procedure is to subtract from the accelerogram its average value (which theoretically should be zero to ensure a zero velocity at the end of the seismic motion).
Alternatively, in the case of digital accelerograms with pre-event, it is possible to remove from the entire signal the average value calculated only on the pre-event portion.
Finally, in the case of more complex instrumental disturbances, more sophisticated baseline correction procedures can be used, for instance by first sub-dividing the velocity signal (obtained by integrating the initial accelerogram) into multiple ranges, by estimating subsequently the drifts relative to each range using least square regression, and finally by removing them.
In processing the accelerometric data contained in ESM, the standard correction procedure has been used, i.e. the subtraction from the accelerogram of its average value.
For further details about the adopted correction procedure see Corrected Record.
- Bedrock
-
Relatively hard, solid rock that commonly underlies softer rock, sediment, or soil.
- Building code Site Class (soil class)
-
Soil (site) class according to a specific Seismic Building Code (e.g. EC8, NEHRP...)
C
- CAV
-
The Cumulative Absolute Velocity is the area under the absolute accelerogram:

The CAV has been found to correlate well with structural damage potential.
- Component
-
One of the three spatial components of the seismic motion.
The two horizontal components, orthogonal to each other, are denoted by N (North-South) and E (East-West).
The Vertical component is denoted by Z. In ESM Z is positive upward
In ESM the waveform components can be oriented not only according to the the traditional North-South, East-West, and Vertical orientations (see SEED_manual, p.134 )
- Corrected Record
-
In a Corrected Record the disturbances present in the original signal at both high and low frequency have been removed or reduced (see Uncorrected Record).[1]
Two subsequent steps are employed in order to correct the low frequency disturbances:
- the baseline is removed in the time domain (see Baseline Correction)
- the accelerogram is high-pass filtered (see Filter Correction)
In order to correct the errors at high frequencies, the accelerogram is low-pass filtered (see Filter Correction)
The following procedure has been considered in the processing of ESM accelerometric data:
- baseline correction (removal of the signal average value);
- application of a cosine taper, with an extension based on a visual inspection of the record (typically between 2% and 5% of the signal total length); The taper is not applied to those records identified as late-triggered (see Triggered Record);
- visual inspection of the Fourier Spectrum, to select the band-pass filter frequency range. When possible, the same frequency range is selected for the three components;
- application of a acausal Butterworth filter of the second order, in the frequency range selected at the previous point;
- double integration of the acceleration to obtain the displacement time history;
- removal of the linear drift present in the displacement time history;
- double derivation to obtain the corrected acceleration, which is compatible with the corrected displacement.
- Coseismic
-
An event or process detected by geological/geophysical tools and analyses that is directly associated with earthquake activity. Such manifestations may include for instance the seismogenic fault rupturing through the ground-surface or geodetic data indicating crustal movement in the region hit by an earthquake contemporaneous with the seismic event.
- Cosenza-Manfredi index ID
-
An energy-related ground motion intensity measure computed as the ratio of the integral of the acceleration squared to the PGA (see PGA) and PGV (see PGA).[9]
- Creative Commons
-
Creative Commons is a nonprofit organization that enables the sharing and use of creativity and knowledge through free legal tools.
D
- DBMS
-
DataBase Management System
A DBMS is a computer-software application that interacts with end-users, other applications, and the database itself to capture and analyze data. A general-purpose DBMS allows the definition creation querying update and administration of databases.
- DDSS
-
Data, Data Products, Services and Software - EPOS related acronym
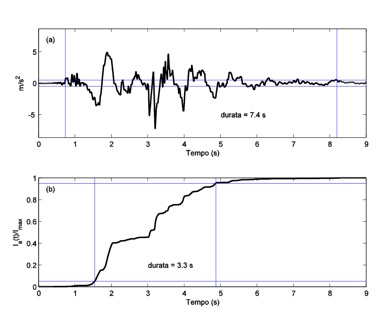
- Duration
-
Duration is defined as the time interval of the accelerometric signal in which the seismic motion is “significant”.[1] To this aim two definitions are often used:
- duration based on the exceedance of a threshold value (bracketed duration): a threshold is fixed, typically 0.05g, above which it is deemed that the motion has relevance for engineering purposes; the duration is the time interval between the first and the last exceedance of this value;
- duration based on the motion intensity: The Arias Intensity function I(t) is calculated (see Arias Intensity), and normalized with respect to its maximum value Imax; the duration corresponds to the time interval t2-t1, where I(t1) = 0.05 and I(t2) = 0.95.
In ESM the seismic motion duration is calculated on the base of the Arias Intensity.
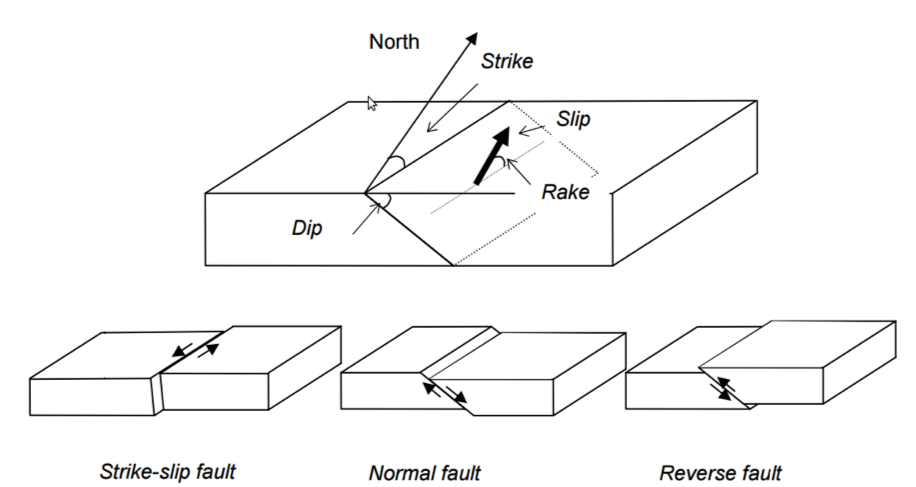
- Dip
-
Inclination of the fault plane from the Earth's surface (measured in degrees)
- DISS
-
Database of Individual Seismogenic Sources
- DOI
-
Digital Object Identifier
A not-for-profit membership organization that is the governance and management body for the federation of Registration Agencies providing Digital Object Identifier (DOI) services and registration and is the registration authority for the ISO standard (ISO 26324) for the DOI system. The DOI system provides a technical and social infrastructure for the registration and use of persistent interoperable identifiers called DOIs for use on digital networks.
- Dt
E
- EC8 site category
-
The seismic site classification is based on the stratigraphic and dynamic properties of the soil profile. Site classes are defined according to the Eurocode 8 as follows:
-Class A: rock or other similar geologic formation, including 5 m (maximum) of surface weathered material. Vs,30 > 800 m/s (see Vs,30);
-Class B: very dense sand or gravel, or very consistent clay, in soil deposits at least several tens of meters depth, characterized by a gradual increase of dynamic properties with depth. 360 m/s < Vs,30 < 800 m/s;
-Class C: medium dense sand or gravel, or consistent clay, in deposits with depth between several tens to hundreds meters. 180 m/s < Vs,30 < 360 m/s;
-Class D: loose to medium dense non-cohesive soil deposits (with or without cohesive soil layers), or medium consistence cohesive materials. Vs,30 < 180 m/s;
-Class E: soil profile consisting of a shallow alluvial layer with Vs values typical of C or D class, and thickness between about 5 m and 20 m, lying on a material with Vs,30 > 800 m/s;
-Class S1: deposits consisting of – or containing one layer at least 10 m thick– high plasticity clays/silts (P1 > 40) with a high water content;
-Class S2: soil deposits susceptible to liquefaction, or sensitive clays, or any other profile which is not included in the A-E or S1 classes.
- EDSF
-
European Database of Seismogenic Faults
- EFEHR
-
European Facilities for Earthquake Hazard and Risk
- EMSC
-
European-Mediterranean Seismological Centre
- Engineering bedrock
-
The unit where a conventional Vs value is first exceeded. This conventional value may vary from one country or practice or code to another and must clearly stated (typical values are 760 m/s, 800 m/s or 1500 m/s).
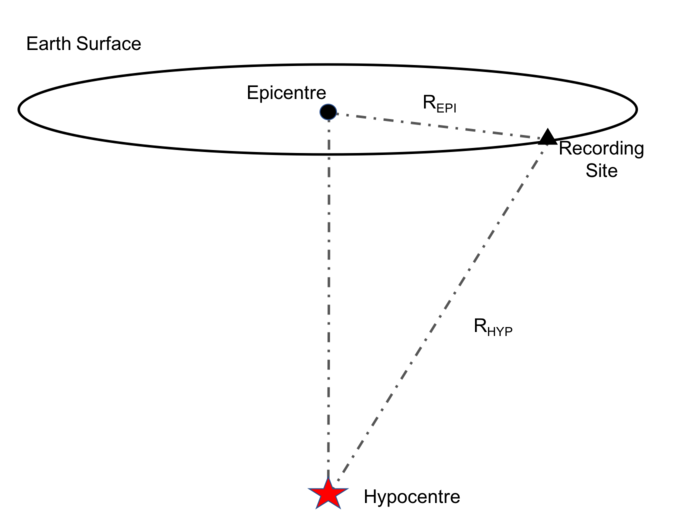
- Epicentral Distance
-
The epicentral distance is defined as the distance on the ground surface between the site and the earthquake epicenter.
This latter is defined as the point on the earth surface placed exactly on the vertical passing from the hypocenter (or focus), where the rupture takes place.
The distance between the site and the earthquake hypocenter is denoted as hypocentral distance.
- Epicentral Intensity
-
The epicentral intensity is the highest value of the macroseismic intensity in the epicentral area.
- EPOS
-
European Plate Observing System
EPOS is a long-term plan to facilitate integrated use of data, data products, and facilities from distributed research infrastructures for solid Earth science in Europe.
- Event
-
The event is the considered earthquake.
It is characterized by the geographical coordinates of the epicenter (latitude and longitude), the Hypocentral Depth, and by the occurrence date (year, month and day).
Other distinctive properties of the seismic event are the focal mechanism and the epicentral intensity.
F
- Fault Plane
-
An earthquake occurs when a volume of rock, subject to deformation mechanisms of tectonic origin, breaks along a weak surface, which is denoted as fault, resulting in a relative displacement between the two blocks of rock separated by the fault plane.
The type of fault is specified according to the orientation (strike), sense of slip (rake) and the inclination (dip) of the fault plane [3]
- Fault Geometry
-
Vertices of the fault plane projection on the Earth's surface, named upper/lower left (UL/UR), Upper/Lower Right (UR/LR). Lower is used to indicate the projections of the submerged fault vertices along the dip.

courtesy of R. Basili
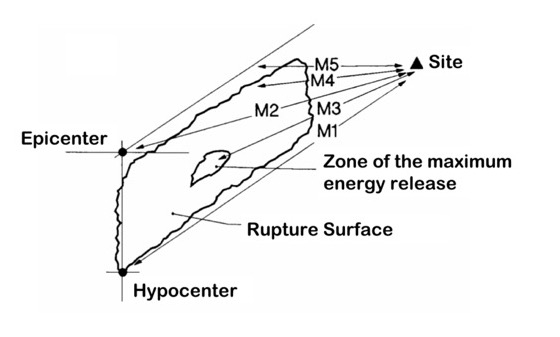
- Fault Distance
-
The fault distance (RF) is one of the measures of the source-site distance currently used in the engineering and seismology applications. It is defined as the minimum distance between the observation point and the earthquake fault.
Different source-to-site distances are commonly used, such as:
Hypocentral distance (M1): distance from the earthquake hypocenter;
Epicentral distance (M2) = distance from the earthquake epicenter;
Distance from the most energetic zone (M3) = distance from the zone of maximum energy release;
Distance from the seismic source or distance from the fault (M4) = minimum distance between the site and the earthquake fault;
Distance from the surface projection of the fault (Joyner-Boore distance) = minimum distance between the site and the fault projection on the ground surface (M5).
The following figure shows the source-to-site distance measures introduced into NGA-West2 database[4]; the right panel illustrates the distance Rx defined to be positive for sites on the hanging-wall side of the fault and negative for sites on the foot-wall side of the fault. The distance RY is zero or positive[5].
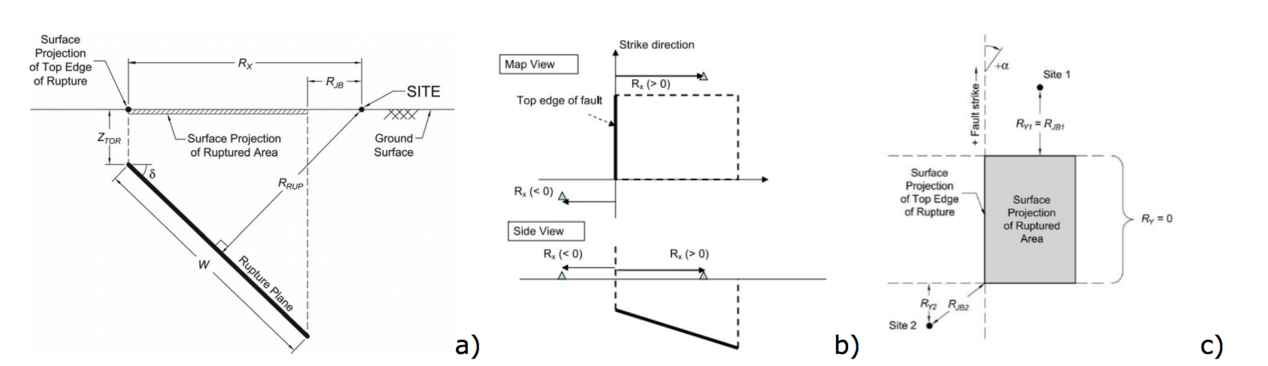
a) Representation of the earthquake source and distance measures using a vertical cross section through a fault rupture plane[5]. b) map (top) and side (bottom) view of the source-to-site distance measure (Rx) for an example fault (thick black line) plane and stations located on the hanging-wall (Rx>0) and foot-wall (Rx<0) side[4]. c) map view of RY definition.[5]
- Fault Scarp
-
The brittle result of a fault that ruptures the ground-surface. When the upper tip of a seismogenic fault lies just below the ground-surface and if mechanical conditions allow so one of the coseismic effects of seismogenic faulting results in the generation or spatial growth of a scarp that can develop either by displacement and/or by lateral extent. The resulting morphology normally differs depending on the geometry type and sense of fault motion. It is prone to be smoothed by exogenous processes in the short term (i.e. rainfall) and by erosion and sedimentation at large in the medium to long term.
- Filter Correction
-
The uncorrected records collected by the recording instrument are generally processed for the following purposes:[1]
a) correction with respect to the instrument characteristic curve;
b) correction of the high and low frequency errors;
c) filtering, in order to highlight or eliminate a particular frequency band.
Such operations are often performed in the frequency domain, using filtering algorithms based on the Fast Fourier Transform (FFT), and schematized by the following procedure:
1. The FFT of the original accelerometric record is performed:

2. The instrument characteristic curve H(ω) is removed. Recalling that A(ω) = H(ω)⋅U(ω), the Fourier transform of the record is obtained, in which the instrument response is removed:

3. The filter is applied in the frequency domain by multiplying the function U(ω) times the filter B(ω), either high-pass, or low-pass or band-pass, depending on the type of disturbance to eliminate or of the frequency band to highlight:

4. The inverse Fourier transform is computed, to obtain the corrected signal in the time domain:

An acausal band-pass second order Butterworth filter has been used to filter the ESM accelerometric data.
The frequency band was selected in each case based on visual inspection of the Fourier spectrum of the signal.
For the complete procedure of signal correction implemented in ESM see Corrected Record.
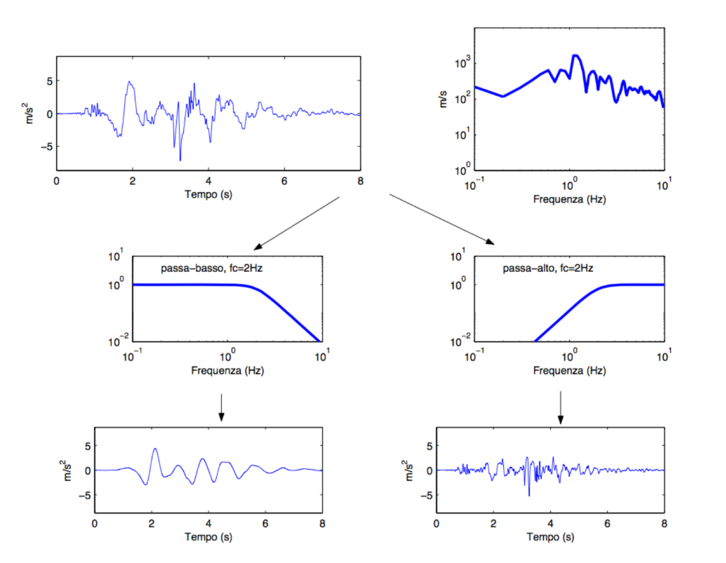
Example of the effect of filter application on an accelerometric signal. Top: EW component of the accelerogram recorded in Gemona del Friuli (GMN) the September 15th 1976 03:16, and corresponding Fourier spectrum. Bottom: the same accelerogram high-pass filtered (left) and low-pass filtered (right), in both cases with a corner frequency fc= 2Hz.[1]
- Flat-File
-
A flat-file is a parametric table which contains metadata and intensity measures of corrected records.
- Focal Mechanism
-
The focal mechanism represents the geometry of fault rupture during an earthquake (see Fault Plane).[3]
It is based on the polarity of the first arrivals of P and S waves recorded by a network of far field seismic stations.
3 basic types of focal mechanisms are distinguished:
1. strike-slip fault: vertical fault plane and relative horizontal displacement of the two blocks divided by the fault;
2. reverse or thrust fault: the Earth’s crust is in extension along a dipping fault plane, with the hanging wall moving downwards relative to the footwall;
3. normal fault: the Earth’s crust is in compression along a dipping fault plane, with the hanging wall moving upwards relative to the footwall.
- Foot-Wall
-
The two opposite side of the fault are defined as hanging-wall or foot-wall; the underlying side of a non-vertical fault surface is the foot-wall.[2]
- Fourier Spectrum
-
The Fourier transform of the signal a(t) is defined as follows:[1]
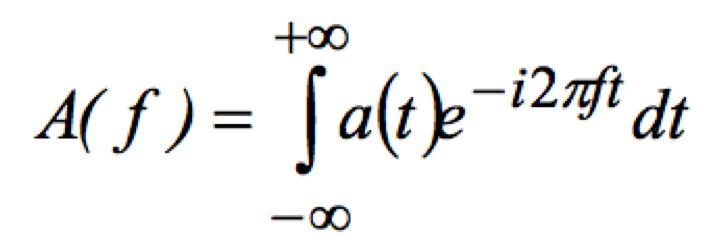
Generally A(f) is a complex function. The modulus of the Fourier transform is denoted as the Fourier Spectrum of the signal a(t):
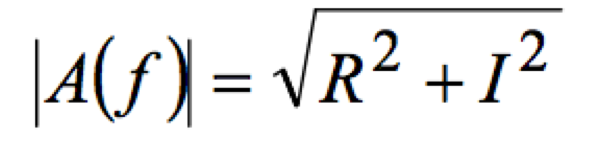
where R and I are the real and imaginary part of A(f), respectively.
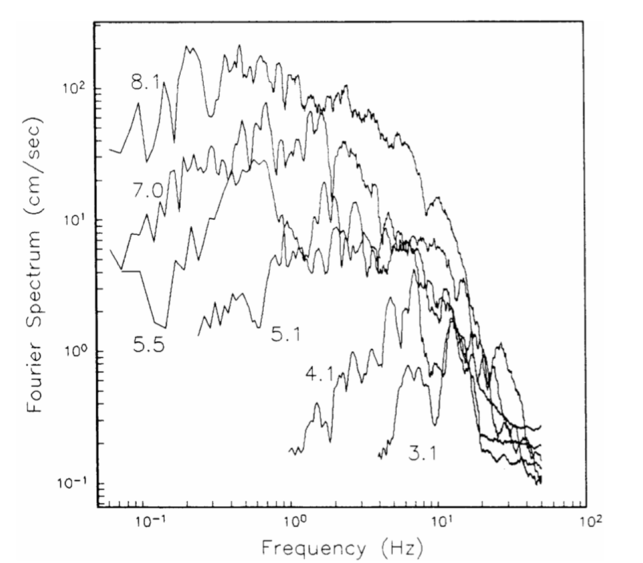
Fourier Spectra of increasing magnitude accelerograms, recorded in 1985-1986 by digital instruments located on the Pacific coast of Mexico (Guerrero network).
- Free-Field Record
-
A free-field record is a record of seismic ground motion, obtained at a sufficient distance from near-by structures, so that its response is not altered significantly in a wide frequency range, indicatively between 0 and 20 Hz. The instrument location (see Housing) should minimize the interaction effect with the host structure or adjacent structures.
- f0
-
Fundamental resonance frequency of soil deposits underneath the seismic station. (see also Seismological Bedrock)
G
H
- Hanging-Wall
-
The two opposite side of the fault are defined as hanging-wall or foot-wall; the overlying side of a non-vertical fault surface is the hanging-wall.[2]
- Hypocenter
-
A point in the Earth (also called earthquake focus) where the rupture of the rocks initiates during an earthquake.
- Hypocentral Depth
-
The Hypocentral depth is the distance between the hypocenter and the epicenter of the earthquake (see Fault Distance).
- Hypocentral Distance
-
The distance between the site and the earthquake hypocenter.
- Historical Seismicity
-
The historical record of ca. pre-XXth century earthquakes that have been parameterized in specific historical catalogues. Most sizable seismic events have caused a number of effects including socio-economic impact on the local to national fabric to the point of being accounted for in numerous historical sources of diverse origin language and reliability.
- Housing
-
Housing denotes the place where the recording instrument is located. Different alternatives are distinguished in ESM: box, bridge, building, cave, dam, ENEL box, gallery, historical building, power plant, quarry, borehole.
- Housner Intensity
-
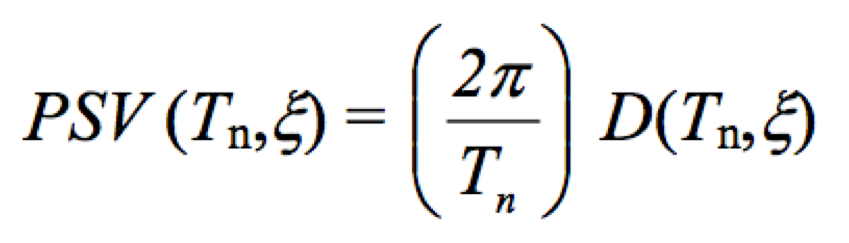
Housner Intensity (or response spectrum intensity) is defined as follows:[1]
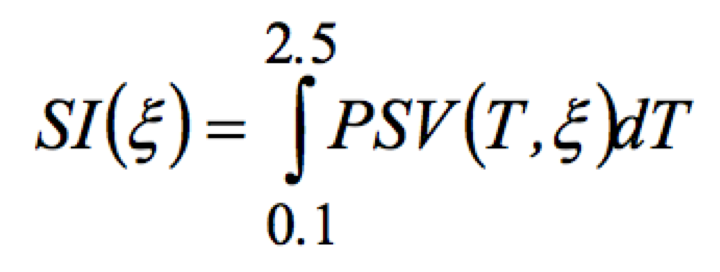
where PSV is the pseudo-velocity response spectrum (see Response Spectrum), T and ξ are the structural natural period and damping, respectively.
Dimensionally, the Housner Intensity is a displacement (cm).
In the case of records contained in ESM, the Housner Intensity was calculated considering ξ = 5%.
This parameter of seismic motion severity is related to the potential damage expected from the considered earthquake, since the majority of structures have a fundamental period of vibration in the range between 0.1 and 2.5 s.
- Hp
-
Cut-off frequency [Hz] of the higth-pass filter.
- H_engineering_bedrock
-
Depth of the engineering bedrock (e.g. defined as corresponding to Vs=800 m/s for EC8).
- H_seismic_bedrock
-
Depth of the Seismological Bedrock.
- HVSR
-
Ratio of the Fourier Amplitude Spectrum of horizontal (vectorial sum) and vertical components of ambient noise, recorded at a site.
- HVSR-FC
-
Ratio of the Fourier Amplitude Spectrum of horizontal (vectorial sum) and vertical components of S-wave coda time window of an earthquake, recorded at a site.
- HVSR-FS
-
Ratio of the Fourier Amplitude Spectrum of horizontal (vectorial sum) and vertical components of the S-wave time window of an earthquake, recorded at a site.
- HVRS
-
Ratio of the Responce Spectrum of horizontal (vectorial sum) and vertical components of earthquake ground motions, recorded at a site.
I
- Instrument Code
-
A two character code that identify the general sampling rate and the response band of the instrument (1th letter), and the family to which the sensor belongs (2nd letter). (see SEED_manual)
- Installation
-
Feature of the station indicating the type of basement of the recording instrument (i.e. Building floor, Pillar, Building basement and Buried).
- Instrumental Seismicity
-
The recent and ongoing record of earthquakes that have occurred since the availability of modern-era seismometers (i.e. since the XXth century). Instruments capable of recording temblors have been first deployed since the end of the XIXth century while the evolving technology allowed for finer and clearer identification of seismic events even of very little magnitude. Modern-era seismometric networks allow to recognize earthquake location and magnitude among other parameters.
- Interseismic
-
An event or process possibly detected by geological/geophysical tools and analyses that occurs between two significant earthquakes. Such manifestations may include for instance low or non negligible seismic activity in the aftermath of a major event mild warping of the ground-surface associated with the medium-term effects of an active fault or geodetic data indicating crustal movement across a particular region known for seismic activity.
J
K
L
- Location Code
-
A zero-to-two alphanumeric code to identify the sensor location of a recording station (see SEED manual, p.37). In the table of the selected waveforms of ESM the Location Code is indicated as Location or Location Code
- Lower-Upper Tolerance [%]
-
Lower-Upper tolerated deviations in percentage terms, which the average spectrum of the records set (see Records set) can have with respect to the target spectrum (see Target Spectrum) in the chosen range of vibration periods
- Lp
-
Cut-off frequency [Hz] of the low-pass filter.
M
- Macroseismic Intensity
-
The macroseismic intensity classifies empirically the earthquake severity according to an ordinal scale (e.g. MCS, Mercalli-Cancani-Sieberg; EMS-98, European Macroseismic Scale) of the effects produced by the ground shaking, on human beings, civil structures (damages to buildings), and environment (geologic and geomorphologic effects).
- Magnitude
-
The earthquake magnitude measures the intensity of the seismic event, based on an appropriate processing of the seismic signal.[1]
Two magnitude definitions are considered in ESM: the local magnitude and the moment magnitude.
The local magnitude ML, or Richter magnitude, is defined as follows:
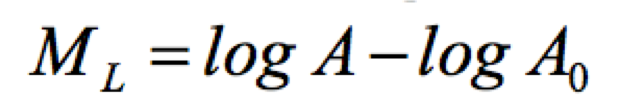
where:
A = peak amplitude, in mm, of the track recorded by a Wood-Anderson (WA) seismograph at a given distance;
A0 = amplitude corresponding to the reference earthquake (“zero”) at the same distance.
The Richter magnitude scale is logarithmic, so an increase of a unit of ML implies an increase of 10 times in the motion amplitude.
Therefore, in moving from ML = 4 (low intensity earthquake) to ML = 7 (strong intensity earthquake), there is an increase in amplitude of 1000 times.
One limitation of the magnitude scale ML is the tendency to saturation for magnitude around 7.0-7.5; this depends on the bandwidth limitations of the WA seismograph, which do not make it suitable for recording the long period oscillations generated by large earthquakes.
The moment magnitude is instead defined from the seismic moment, which is defined as:
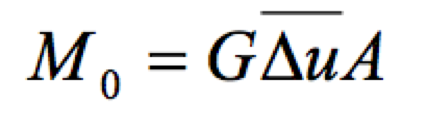
where G is the shear modulus of the crustal material where the seismic rupture occurs, A the area of the rupture surface in the seismogenic fault, and Δu;
the average coseismic slip on the rupture surface.
The seismic moment contains the most important physical parameters associated with the energy release during an earthquake.
The moment magnitude MW is calculated based on the seismic moment as follows:
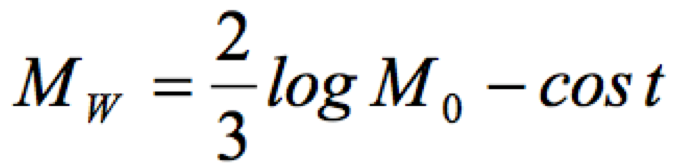
where cost = 10.7 if M0 is measured in dyne⋅cm and cost = 6.0 if M0 is measured in N⋅m.
M0 is a quantity that can increase indefinitely as the source and dislocation dimensions increase, so MW does not saturate.
This concept is illustrated in the following by the relationship between MW and the other commonly used magnitude scales.
This shows that, in practice, MW = ML for MW ≤ 6.2 can be assumed.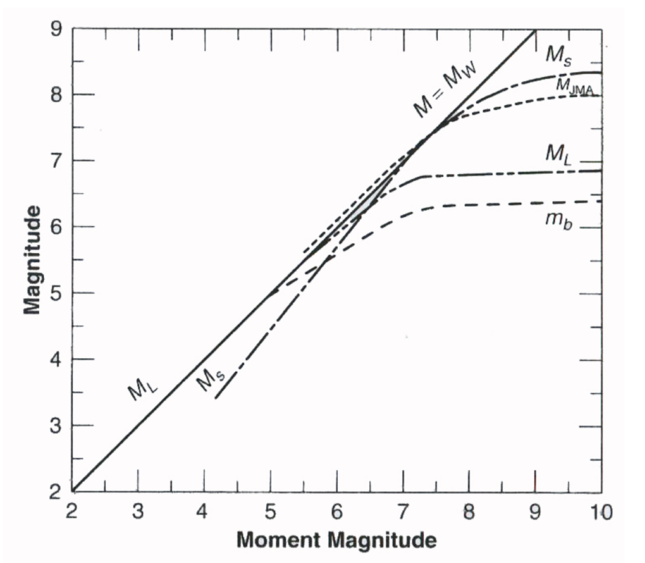
Relationship between moment magnitude MW and other magnitude scales, in particular the local magnitude ML.[1]
- Metadata
-
Metadata is data about data content and is critical for analysis of timeseries data such as seismic data (see IRIS glossary).
Examples of metadata in ESM are: time of first sample, sampling interval, and magnitude).
- Microtremor
-
Continuous ground motion constituting the background noise for any seismic measurement.
- Microzonation
-
Microzonation is the identification of separate individual areas having different potentials for hazardous earthquake effects.
- Morphology
-
This heading indicates the morphology of the site where the recording instrument is located. The following morphology types are distinguished: plain, valley centre, valley edge, alluvial fan, saddle, slope, edge of scarp and ridge.
N
- Network Code
-
The code associated to the recording Seismic Network according to the International Federation of Seismograph Network (FDSN).
- Nodal Plane
-
The two ortogonal planes that intersect the focal sphere surrounding the earthquake source; the fault plane is the nodal plane on which the slip occurs.
- NTC 2018 site category
-
The seismic site classification is based on the stratigraphic and dynamic properties of the soil profile. Site classes are defined according to the NTC 2018 as follows:
-Class A: Outcropping rock masses or very rigid soils characterized by shear wave velocity larger than 800 m/s, possibly including poorer mechanical soils with a maximum thickness of 3 m on the surface. Vs,eq > 800 m/s;
-Class B: Soft rocks and deposits of very thick coarse-grained soils or very substantial fine-grained soils, characterized by improved mechanical properties with depth. 360 m/s < Vs,eq < 800 m/s;
-Class C: Deposits of medium thick coarse-grained soils or medium substantial fine-grained soils with substrate depths greater than 30 m, characterized by improved mechanical properties with depth. 180 m/s < Vs,eq < 360 m/s;
-Class D: Deposits of poorly thickened coarse-grained soils or thin-grained soils with substrate depths of more than 30 m, characterized by improved mechanical properties with depth. 100 m/s < Vs,eq < 180 m/s;
-Class E: Soils with characteristics and equivalent velocity values as those defined for categories C or D, with depth of bedrock not exceeding 30 m.
- Nucleation Point
-
The point over the fault plane where an earthquake rupture starts (see Hypocenter).
O
P
- PGA
-
The PGA (Peak Ground Acceleration) denotes the maximum ground acceleration recorded during the seismic shaking by the three components of the seismic station.
- PGD
-
The PGD (Peak Ground Displacement) denotes the maximum ground displacement recorded during the seismic shaking by the three components of the seismic station. This parameter is obtained by integrating twice the acceleration time history, and taking the maximum value of the corresponding displacement time history.
- PGV
-
The PGV (Peak Ground Velocity) denotes the maximum ground velocity recorded during the seismic shaking by the three components of the seismic station. This parameter is obtained by integrating the acceleration time history, and taking the maximum value of the corresponding velocity time history.
- PID
-
A Persistent IDentifier is a long-lasting reference to a digital resource (see What are Persistent identifiers (PIDs) in ORCID Support).
- Proximity to Structure
-
Feature of the station indicating proximity to structures which could influence the seismic response of the soil (i.e. Free-field, Close to structure, No information, Inside structure, and Strcture related free-field)
- Pulse Like
-
Waveform characterized by double-sided pulse in the velocity trace.
- Pulse Azimuth
-
The bearing, relative to north, along which the double-sided pulse in the velocity trace is detected.
Q
R
- Records set
-
The combination of accelerograms whose spectra are in the average compatible with the target spectrum (see Target Spectrum) within the assigned tolerance (see Lower-Upper Tolerance [%]) and range of vibration periods
- Recurrence Interval
-
The average time span between two comparably large earthquakes on a particular seismogenic fault. When at least two damaging earthquakes (the ones that would likely be well recorded also in historical seismicity sources) have been positively associated with a given active fault the time interval that separates them may provide tentative information concerning the periodicity of seismic events having similar magnitude causing damaging effects. Such interval – if reliably ascertained which requires broad and robust geological evidence – is likely to be far from ‘regular’ for a number of seismotectonic constraints. However it may yield some information concerning the broad time window after which the next comparable earthquake may be expected based on the time elapsed since the last recorded one.
- Relational Database
-
A relational database incorporates multiple tables with methods for the tables to work together.
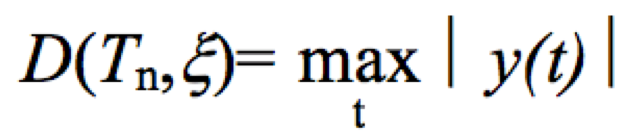
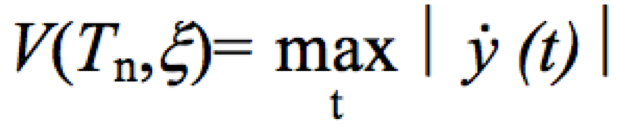
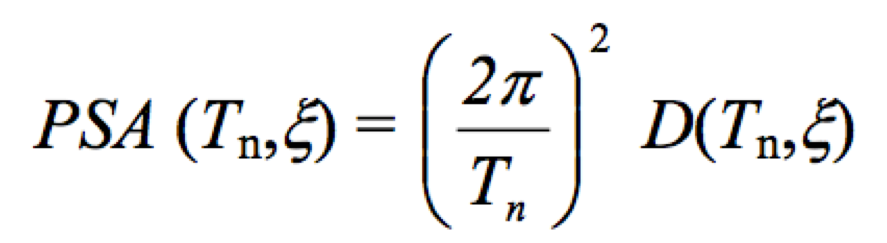
- Response Spectrum
-
The response spectrum provides the maximum response (in terms of relative displacement, relative velocity or absolute acceleration) of an harmonic single-degree-of-freedom (dof) oscillator, subject to an arbitrary accelerogram, as a function of the structural period Tn and of the damping ratio ξ (usually a standard value equal to 5% of the critical damping is used, generally applicable to structures). The maximum amplitude of the response is obtained by integrating the equation of motion of the harmonic oscillator:[1]
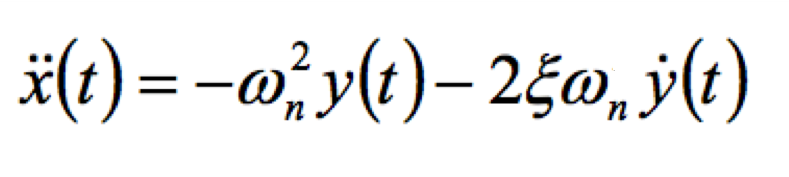
where: y(t) is the relative displacement of the oscillator with respect to the ground and ωn is the oscillator natural circular frequency
The following definitions are introduced:
displacement spectrum (relative)
velocity spectrum (relative)
acceleration spectrum (absolute)

The pseudo-acceleration and pseudo-velocity spectra are also widely used in practice. They are defined as a function of the displacement spectrum as follows:
pseudo-acceleration spectrum:
pseudo-velocity spectrum:
The meaning of the acceleration response spectrum and the procedure for computing the spectral ordinates for selected periods on one of the ESM records is illustrated in the following figure:
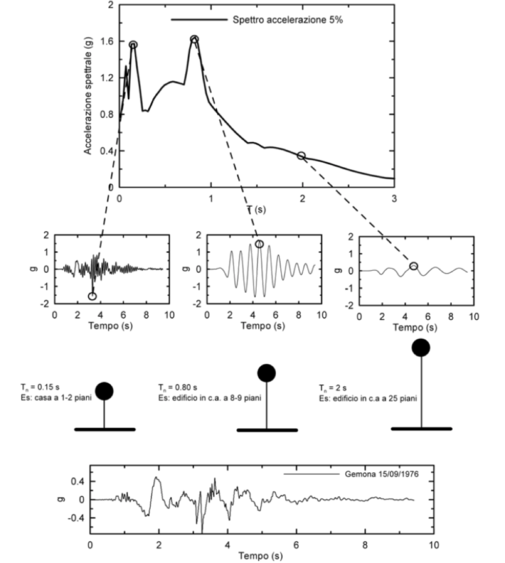
Example of construction of the acceleration response spectrum for the Gemona accelerogram (EW component, bottom) recorded during the Friuli earthquake, 15/09/1976, 03:15.[1]
- Rake
-
A parameter describing the slip direction on a fault, measured as an angle in the fault plane between the fault strike and the slip vector
- REXELweb
-
A web-tool for the automatic selection and scaling of spectrum-compatible (see Spectral Matching) ground-motions from the Engineering Strong Motion Database (ESM) for dynamic analysis of structures
- RotD50
-
Median value of the distribution of an intensity measures (e.g. PGA) of the rotated waveforms[8].
- RotD100
-
Maximum value of the distribution of the intensity measures (e.g. PGA) of the rotated waveforms[8].
- RotD00
-
Minimumm value of the distribution of the intensity measures (e.g. PGA) of the rotated waveforms[8].
S
- Sampling Inteval
-
The Sampling Interval (Time Step) corresponds to the time step between two consecutive points of the record, which is obtained either directly from a digital instrument or from the digitization of the analog signal.
- Scaled records
-
A set of accelerograms that require to be linearly scaled in amplitude to match the target spectrum (see Spectral Matching)
- Score
-
Distance metric between the target (see Target Spectrum) and the spectrum of an individual waveform.[11]
- Seismic Array
-
An ordered arrangement of seismometers, the data from which feeds into a central data acquisition and data processing unit.
- Seismic Moment
-
The magnitude of the component couple of the double couple that is the point force system equivalent to a fault slip in an isotropic elastic body. It is equal to rigidity times the fault slip integrated over the fault plane.
- Seismic Network
-
A seismic network indicates a set of recording instruments (short-period, broadband, or accelerometric sensors) managed by a single institution.
Each seismic network is univocally identified by an alphanumeric code defined by the International Federation of Digital Seismograph Networks (see FDSN)
In the following, an example of accelerometric network: IT - Italian Strong Motion Network [DPC]
- Seismic Sequence
-
The seismic sequence is a series of earthquakes which occur in the same region at close intervals of time. Typically a seismic sequence consists of a strong and severe seismic event (mainshock), possibly anticipated by a series of minor earthquakes (foreshocks), and always followed by many events of lower intensity (aftershocks).
- Seismogenic Fault
-
The brittle tectonic element either causative of a particular seismic event/mainshock(s) of a given sequence or deemed potentially responsible for a future one. It is recognized and defined using all available geological and geophysical data suitable for its identification thus depending from constraints including (but not limited to) its dimensions its structural position and its effects on the ground-surface (if any whether ductile or brittle).
- Seismological Bedrock
-
The geological unit that, because of the impedance contrast with the upper layers, controls the lowest (fundamental) resonance frequency (f0) peak; note however that some scientists consider the seismological bedrock as the crustal unit where the S-wave velocity is reaching a "crustal" value between 3.5 and 4.0 km/s.
- SERA
-
Seismology and Earthquake Engineering Research Infrastructure Alliance for Europe
The Seismology and Earthquake Engineering Research Infrastructure Alliance for Europe (SERA) aims to reduce the risk posed by natural and anthropogenic earthquakes based on innovative research and development projects. SERA will significantly improve the access to data services and research infrastructures for scientists and other professionals.
- SHARE
-
Seismic Hazard Harmonization in Europe
SHARE is a Collaborative Project in the Cooperation programme of the Seventh Framework Program of the European Commission. SHARE's main objective is to provide a community-based seismic hazard model for the Euro-Mediterranean region with update mechanisms. The project aims to establish new standards in Probabilistic Seismic Hazard Assessment (PSHA) practice by a close cooperation of leading European geologists seismologists and engineers.
- Slip
-
The relative displacement of formerly adjacent points on opposite sides of a fault.
- Spectral Matching
-
Property of a combination of accelerograms, whose spectra, on average, is compatible with the target spectrum (see Target Spectrum) within the assigned tolerance (see Lower-Upper Tolerance [%]) and given range of vibration periods
- Spectral Shape Factor Np
-
A spectral-shape-based ground motion intensity measure computed as the ratio between the average spectral ordinate Saavg(T1..TN) in the period range [T1...TN] normalised by Sa(T1), with T1 the fundamental period of the structure.[10]
- SQL
-
The Structured Query Language is a special-purpose programming language designed for managing data held in a relational database management system (RDBMS).
- Station
-
Station denotes the recording instrument and its physical location.
Each station is univocally identified by the Network Code and the Station Code
Additional information concern a current name (if available), the geographical coordinates, the Location Code, the Instrument code, the location of the instrument housing, the EC8 site category, the Vs,30 value, the topography, the morphology, and the number of waveforms recorded by the instrument.
- Station Code
-
3 to 5 characters associated to the Station.
- Surface geology
-
Geological/lithological information from available cartography (geological & thematic) and geological surveys
- Strike
-
The bearing, relative to north, of the line defined by the intersection of the fault plane and the Earth's surface (measured in degrees);
The strike direction is that one of the two horizontal directions in the fault plane for which the block containing the hanging wall is on the right, as viewed by an observer looking along strike [2].
T
- Target Spectrum
-
A 5%-damped pseudo-acceleration elastic response spectra tipically defined according to building codes or uniform hazard spectra (see Uniform Hazard Spectrum) and used as reference spectrum for seeking-out spectrum-compatible accelerograms (see Spectral Matching)
- Time of first sample
-
To synchronize the record with respect to the Greenwich Meridian Time (GMT), the time of first sample of the record is given, when available.
- Time History
-
The sequence of ground-motion intensity values measured at a set of fixed times. Also termed time series.
- Type of Fault
-
The type of fault is defined according to the orientation (strike), the sense of slip (rake) and the inclination (dip) of the fault plane.
Strike-Slip Fault: A fault whose relative displacement is purely horizontal; if the block opposite an observer looking across the fault moves to the right, the slip style is termed right-lateral ; if the block moves to the left, the motion is termed left-lateral.
Dip-Slip Fault: A fault whose relative displacement is mostly shifted vertically;if the overlying block moves down the dip of the fault plane, the fault is termed normal; if the rock above the fault moves up, the fault is termed reverse. A thrust fault is a reverse fault with a dip of 45 degrees or less. Oblique-slip faults have significant components of different slip styles.
- Topography
-
The following topographic categories are considered, according to the Italian Building Code (Norme Tecniche per le Costruzioni, 2018), close to those of the EC8 Part 5:
- T1: plains, slopes and isolated hills with an average inclination i %lt; 15°
- T2: slopes with an average inclination i %gt; 15°
- T3: hills or mountains with a ridge width much smaller than the base width and average inclination 15° %lt; i %lt; 30°
- T4: hills or mountains with a ridge width much smaller than the base width and average inclination i %gt; 30°
- Triggered Record (Late/Normally)
-
In a late triggered record, the recording instrument triggered after the arrival of the first seismic waves of significant amplitude. The recorded signal is then characterized by a high initial value, if compared to the peak value of the signal.
In a normally triggered record the recording instrument triggered early enough to properly describe the first arrivals of the seismic waves.
- T90
-
Time interval [s] between the points at which 5% and 95% of the total energy has been recorded (see Arias Intensity).
U
- Uncorrected Record
-
The uncorrected record (also called raw record) is the signal coming from the recording instrument after the analog-digital conversion and transformed by calibration factors to the proper measurement units. This signal typically contains instrumental errors in low and high frequency (noise or instrumental drifts), which are subsequently removed by the processing procedures (see Corrected Record).
- Uniform Hazard Spectrum
-
A response spectrum with ordinates having equal probability of being exceeded in a specified span of time at a given site.
V
- Vs profile
-
The Vs profile contains the information on the propagation velocity of shear (S) waves in the soil underneath or in the vicinity of an accelerometric station, as a function of depth. Typically the stratigraphic profile is defined by layers of varying thickness, each of them characterized by the corresponding shear waves velocity, expressed in m/s. The knowledge of the S-wave velocity is one of the most important parameters for the mechanical characterization of the site of interest, and its classification (see EC8 site category and Vs,30)
- Vs,30
-
The Vs,30 is a suitable average measure of the shear (S) waves propagation velocity in the soil, within the first 30 meters of depth from the ground level. It is defined as follows:
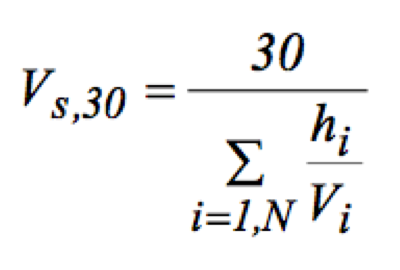
where hi and Vi are the thickness (in m) and the shear wave velocity Vs (in m/s) of the N soil layers present within the first 30 m.
In ESM the attribution of the Vs,30 value derives from different estimate methods (i.e. From Vs profile, Vs profile lower 30 m: from[6], Vs profile lower 30 m: assuming the deepest layer down to 30 m, Literature or Insufficient depth of the Vs profile);
If the depth of the Vs profile is lower than 30 m, the VS,30 is determined using the Boore (2004)[12] empirical correlation for shallow velocity models.
Furthermore, in ESM Vs,30 values (in m/s) inferred from slope are also available[7]. - Vs(z)
-
Subsoil velocity profile of shear-wave (VS) as a function of the depth (z)
- Waveform
-
The waveform is the visual form of the recorded time history of wave motion. In ESM, under Waveform plot previews, the uncorrected acceleration time history (see Uncorrected Record), the corrected acceleration, velocity and displacement (see Corrected Record) are displayed, together with the Fourier spectrum (see Fourier Spectrum ), the acceleration and the displacement response spectra (see Response Spectrum).
- WEB Service
-
A Web service is a service offered by an electronic device to another electronic device communicating with each other via the World Wide Web.
W
X
Y
Z
- Z top
-
The depth of the top edge of the fault.
- [1]
- [2]
- [3]
- [4]
- [5]
- [6]
- [7]
- [8]
- [9]
- [10]
- [11]
- [12]
References
Faccioli E. and R. Paolucci: “Elementi di Sismologia applicata all’Ingegneria”, Pitagora, 2011, in Italian.
Zollo A. and Emolo A.: “Terremoti e Onde”, Liguori, 2005, in Italian.
Aki K. and Richards P.: “Quantitative Seismology”, University Science Books, ISBN 0-935702-96-2, 704pp, 2002.
Ancheta TD, Darragh RB, Stewart JP, Seyhan E, Silva WJ, Chiou BSJ, Wooddell KE, Graves RW, Kottke AR, Boore DM, Kishida T (2014). NGA-West2 database. Earthquake Spectra, 30(3), 989-1005.
Kaklamanos, J., Baise, L.G., Boore, D.M. (2011). Estimating unknown input parameters when implementing the NGA ground-motion prediction equations in engineering practice. Earthquake Spectra, 27 (4), 1219-1235.
Boore D.M.: “Estimating Vs(30) (or NEHRP Site Classes) from Shallow Velocity Models(Depths < 30 m)”, Bulletin of the Seismological Society of America, Vol. 94, No. 2, pp. 591–597, April 2004.
Wald DJ, Allen TI (2007). Topographic slope as a proxy for seismic site conditions and amplification. Bulletin of the Seismological Society of America, 97(5), 1379-1395.
Boore DM (2010). Orientation-independent, nongeometric-mean measures of seismic intensity from two horizontal components of motion. Bulletin of the Seismological Society of America, 100(4), 1830-1835.
Cosenza, E. and Manfredi, G. (2000). Damage indices and damage measures. Prog. Struct. Engng Mater., 2: 50-59
Bojórquez E., Iervolino I. (2011). Spectral shape proxies and nonlinear structural response. Soil Dynamics and Earthquake Engineering, 31(7): 996-1008
Iervolino, I., Galasso, C., Cosenza, E. (2010). REXEL: computer aided record selection for code-based seismic structural analysis. Bulletin of Earthquake Engineering 8, 339-362
Boore, D.M., 2004. Estimating V̄s(30) (or NEHRP Site Classes) from Shallow Velocity Models(Depths < 30 m). Bull. Seismol. Soc. Am., 94 (2), 591–597. doi:https://doi.org/10.1785/0120030105
Links
https://earthquake.usgs.gov/learn/glossary/